Ian Ardouin-Fumat

Overview / Process

Can we make open science accessible beyond academia? Into the Okavango turns a field expedition in Botswana into an immersive online experience and a user-friendly API.

Partnering with ornithologist Dr. Steve Boyes, the Office for Creative Research developed a technology suite enabling the live collect, processing and visualization of thousands of data records from the field.

04/09/2015

The beating heart of our planet

The Okavango Delta is one of the world’s last great wetland wildernesses. Although the Delta has been awarded UNESCO WHS Status its catchments in the highlands of Angola are still unprotected and largely unstudied. This project, Into the Okavango, started in 2013 to become a series of expeditions funded by National Geographic, as a journey along the Okavango river from its Angolan catchments to its untouched delta in Botswana.

Satellite view of the Okavango Delta

The expeditions, led by biologist and wilderness protector Steve Boyes, involves teams of Ba'Yei, scientists, engineers and adventurers with the shared goal of documenting wildlife and engaging a broad audience in the protection of this African cradle of life.
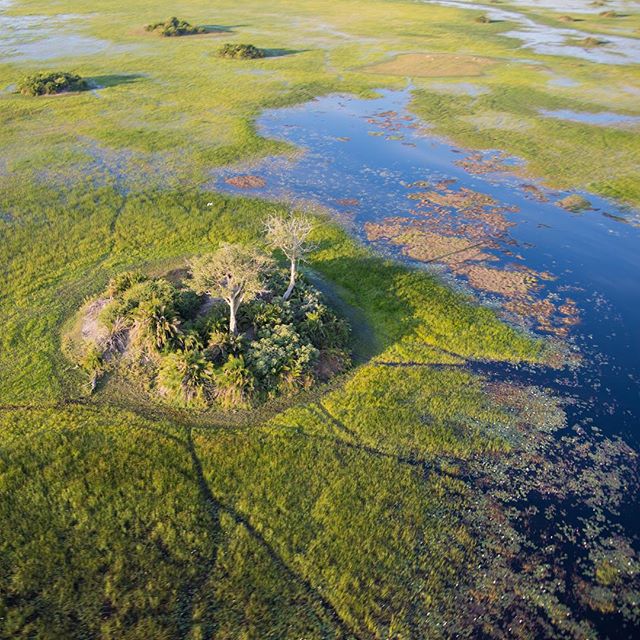
The Office for Creative Research set out to visualize the data coming from this epic journey in real time, and communicate it to a broad audience in an engaging, interactive way. The website resulting from this effort displays data which is uploaded daily, via satellite, by the expedition team.

Besides studying wildlife sightings, IntoTheOkavango.org aspires to document the human effort behind the project. Explorers are provided with a number of tracking devices and sensors, as well as monitored social media profiles that recount their experience of the journey in real time. The site is designed as a diary for people to follow the adventurers.

Beyond the protection of the Okavango Delta as an immediate goal, the many people behind the project commit to demonstrate how field science can become an open process. The sites makes its data available through a public API, allowing anyone to remix, analyze or visualize the collected information beyond our initial vision.

Into the Okavango 2014

04/21/2015

From the field to your screen

From a technical perspective, Into the Okavango stands out for the number and diversity of data sources it brings together. From the field, the expedition tracks everything geo-located. Team member positions, wildlife sightings, images and sound recordings are collected, sent via satellite, ingested to a database, made available through our API and visualized in real time by our web platform. The sophisticated pipeline in place to enable this is the brilliant work of Brian House, OCR's own Jer Thorp, and Shah Selbe.

Connected devices and sensors are constantly tracking the expedition as it unfolds

Besides field data, the Okavango expedition records the extensive content sent by team members on multiple social media platforms: tweets, Instagram posts, podcasts, Medium essays... All of these are pulled from their respective APIs to report the pulse of the expedition as it unfolds.

Since 2015, Shah Selbe and his organization Conservify have deployed a number of sensor stations on the field

Finally, since the 2015's expedition, explorer Shah Selbe and his organization Conservify have been busy developing sensor stations deployed on the field, in order to give constant reporting on the status of the delta, through water quality and meterology sensing.

04/27/2015

Can you slap a design on this in the next 3 hours?

For me, Into the Okavango started as a 3 hour project as OCR's co-founder Jer Thorp asked me to design a basic interface on a map he had developed for National Geographic explorer Steve Boyes. As new expeditions were planned in the following years, the platform gained in complexity, features, and diversity of data sources.

In 2013, 3 hours were spent on the origin design of Into the Okavango

While the original expedition was tracked using a beacon tracking device located on one of the expedition's canoes, the second issue allowed us to visualize each team member's geo-location in real time via GPS tracked wristbands. Following each adventurer's heartbeat all along the expedition gives us a glimpse at their mindset as they travel across the delta.

One week spent on the project in 2014 let us create a more interactive experience

The third issue of the Okavango expeditions took the adventure to another level, as it turned in a 120 days journey, involved several teams of researchers, and set in motion the creation of a feature-length documentary by National Geographic. The new version of the platform involved the creation of new sections encouraging people to explore large quantities of content posted by explorers on social media, as well as exploring information by themselves via a user-friendly API explorer.

A full-blown project, 2015's expedition took weeks of work to implement map, journal and API interactions

As intotheokavango.org matured to become a full-fledged exploration platform, the number of expeditions per year started multiplying, and what was a one-afternoon gig had become a major project for our studio.

04/29/2015

Open, accessible data

Data visualization can sometimes be a dead-end, as it displays highly-curated stories that can't really be appropriated or remixed by their audiences. If our platform means to become a centralized entry point for Okavango field data, it has to be an accessible, flexible one. To this end, the 2014 version of the site provides people with a user-friendly API explorer.

The API explorer and its visual output — Genevieve Hoffman

Designed and developed by creative researcher Genevieve Hoffman, the API explorer provides people with simple tools to question our database. The system takes simple parameters and outputs information in flexible formats, from raw data sets to maps and diagrams that can be reused by everyone.

A visualization of all wildlife sightings captured during the 2014's expedition — Jer Thorp

Our hope is to develop a platform that will be appropriated by students, journalists, artists and developers. As we see people exploring the information we collected, we find our project living beyond our initial vision.

07/15/2016

Into the Okavango 2016: sensor stations and a major revamp

With 3 expeditions planned this year and new commissions by National Geographic, Okavango 2016 was an opportunity for consolidating our platform and refining its visual design. We spent weeks defining a new coherent framework, that fits the many features and data sources that had accumulated over the years.

Still in development, the latest version of ITO enables to explore current and past expeditions with a consistent data treatment. It spends more time explaining the human context of the expedition, and enables to interact with new data sources, including deployed sensor stations and 360 cameras.

Into the Okavango 2016, home page

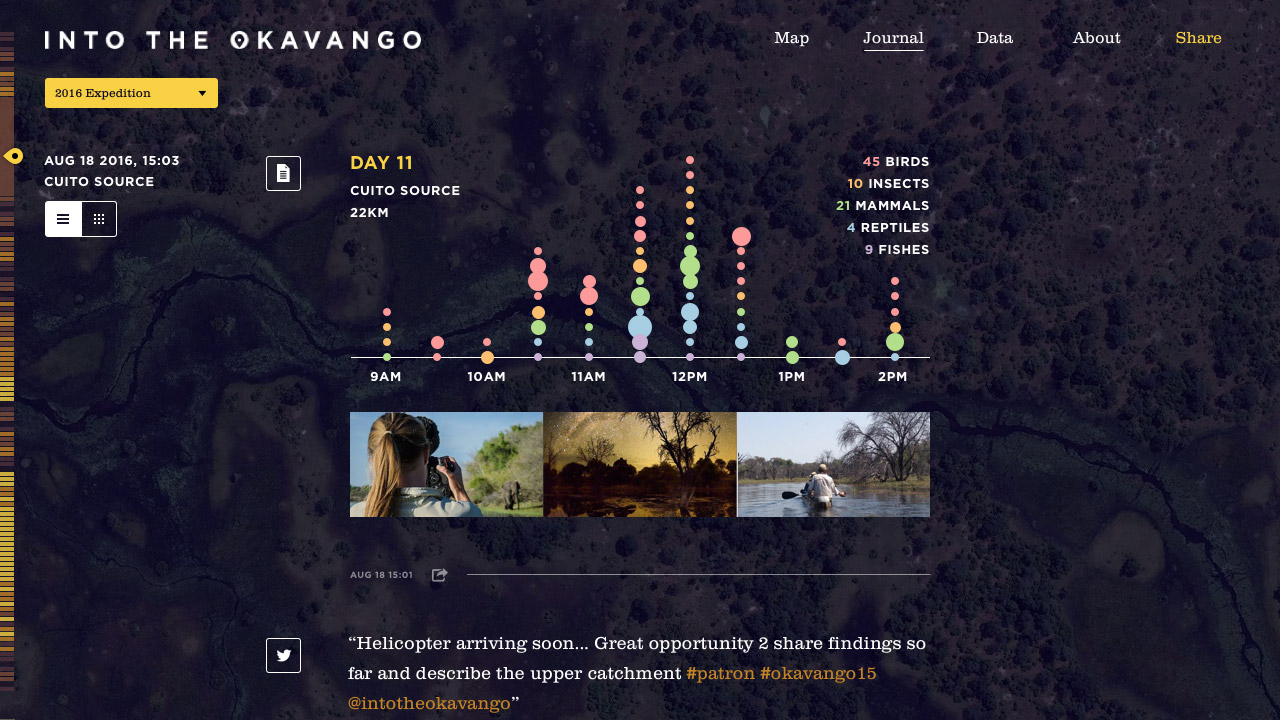
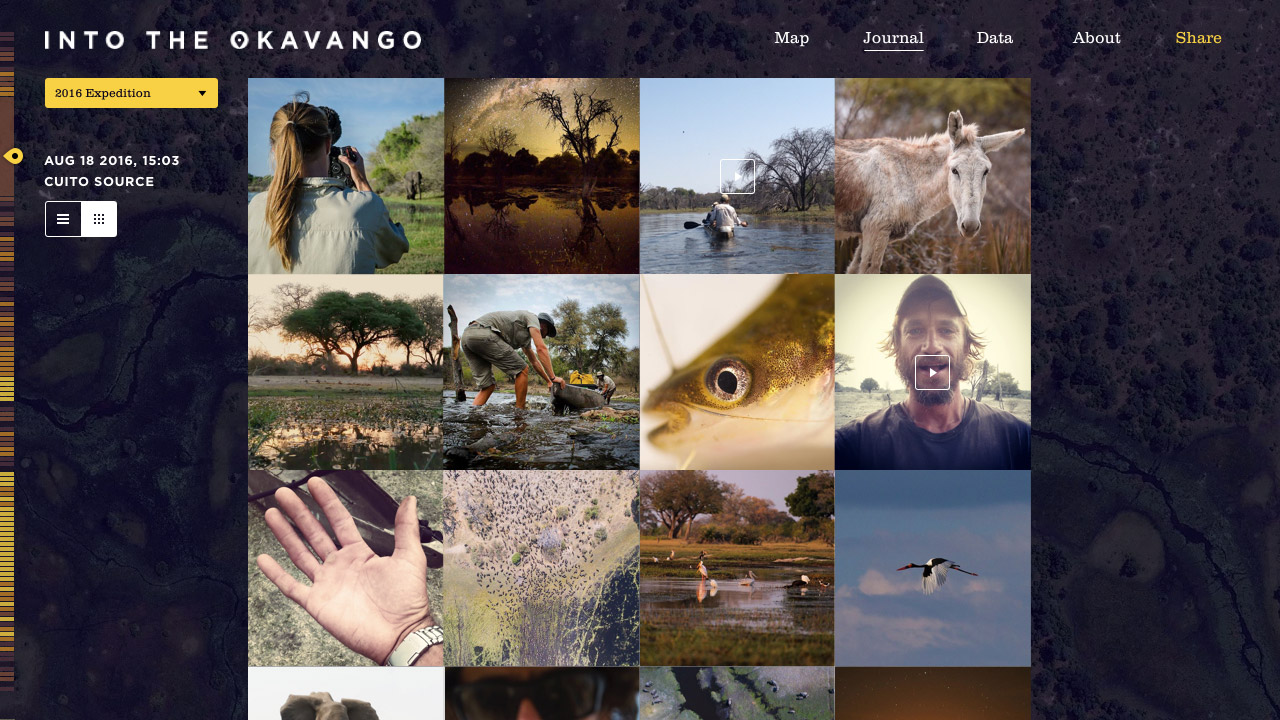
The journal section was also redesigned to focus on displaying high quality media content, now accessible through blog entries and gallery views. Generated daily reports and videos give an overview of each day of the expeditions.

Journal page showcasing a daily data report

The API Explorer, refined by Jane Friedhoff, now provides access to multiple map outputs, from specific species plotting to density hexbin visualizations.

Maybe even more challenging, the site was designed and built to be equally functional on mobile platforms. The expedition can now be followed on these devices, where most of our audience has been following our expeditions through social media.

12/02/2016

Wordpress but for field research

While 2016 was an exciting year for Into the Okavango—3 new expeditions were conducted and documented—it certaintly was the birth of its sibling project that will keep us the busiest.

A first pass at Fieldkit's visual identity

Fieldkit is a spin-off project commissioned by National Geographic, aimed at creating a generic version of Into the Okavango: A one-click open platform for field researchers and explorers. The platform will help people creating their own connected expedition by providing them with a suite of sensors and automatically generated visualizations.

The project, led as a collaboration between the OCR and Conservify, will be released to selected research teams in early 2017. For this occasion, I will be leading the frontend design and development efforts.